Statistics & Probability
A section of the You Cubed site focused on data science. See Data Talks to promote student talk.
Gapminder. Animating data for a changing world.
Dollar street. See the reality behind the data. Everyday life in hundreds of homes from around the world.
NZ teachers' resources organised by curriculum level. Searchable by keyword. Complete the school census so your students experience being part of the data set.
Slowing revealing features/info of graphs to promote sense-making of data and graphs. Each example links to a google slide deck to slowly reveal more about each graph (see notes for teacher prompts).
CODAP: Common Online Data Analysis Program. An introduction video and links to activities to support the teaching of data science.
Flowing data explores how we use analysis and visualization to understand data and ourselves.
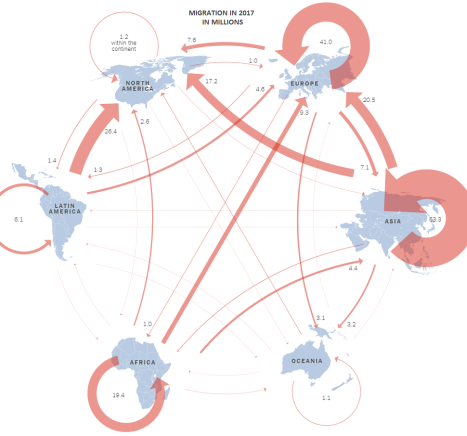
Graphs, maps and charts from the New York Times, and an invitation to students to discuss them.
Quantifying Probabilistic Expressions. How does your perception of how words translate to probabilities compare to others?
Teaching Statistics is awesome. Anna Fergusson's awesome blog to support statistics teachers and to share statistics love.
Statistics and Data Science Educator is an online journal set up for teachers. It has peer-reviewed lesson plans for teachers at all levels, early childhood to graduate.


